DXY Monthly, Weekly, Daily Chart - 29TH AUG 2024
The dollar index seems to be heavy with the downside direction. Lots of sell stops can be seen on the higher time frame particularly the Weekly Time frame. It will be interesting to see how the market delivers there especially with the latest news that the time to cut interest rates has come.
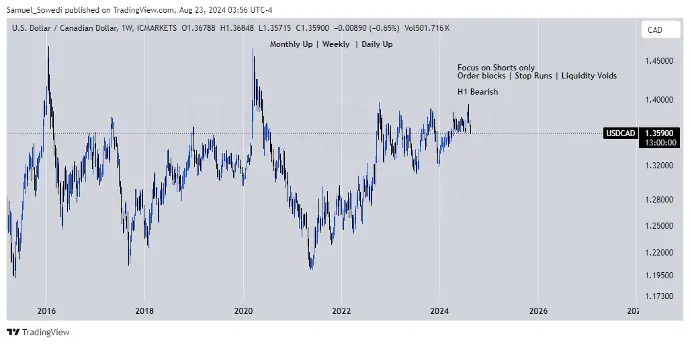
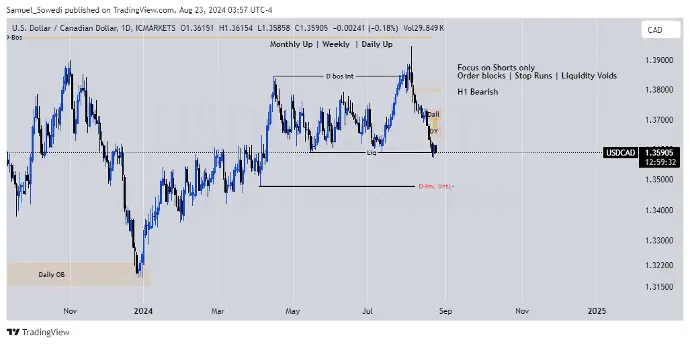
USDCAD Monthly, Weekly, Daily Chart - 23RD AUG 2024
USDCAD is an interesting pair to look at. From a daily time frame, we can see the price is at extreme discount levels. However, there is no sign for us to go long at the moment. Usually, when market is at discount levels, we expect a little bit of consolidation since pairing of orders happens at this level. For now, we are Neutral with the pair.
I however expect price to see price react from the Daily Liquidity void and push down so that we can a structural swing low. After this, we are still bullish, we can expect price to violate the swing low on the daily time frame and push higher. Then and only then will we look for longs.
For, we Tape Read.
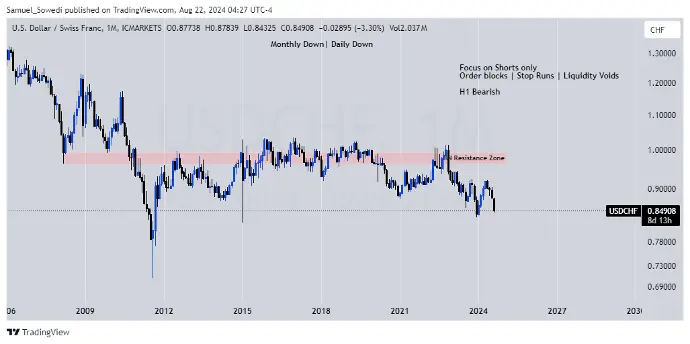
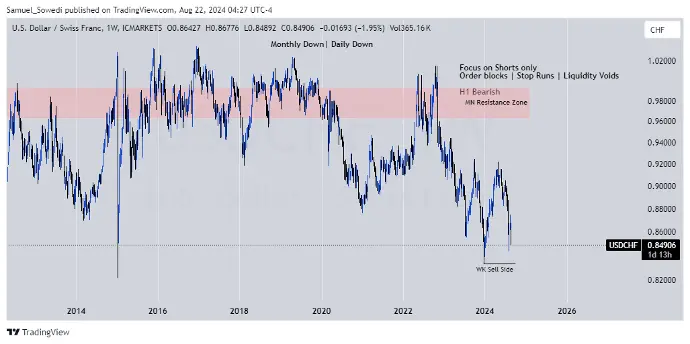
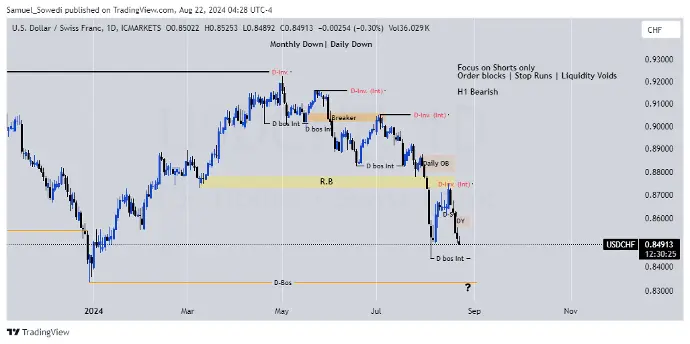
USDCHF Monthly, Weekly, Daily Chart - 22ND AUG 2024
USDCHF currency pair is generally in down trend from the higher Time frames. Market is going for the sell stops. A quick run will be the internal daily swing low and the larger target is the external weak daily swing low. We want to wait for market to return to place of fair valuation before we can place our sell orders to benefit from the move. But if the market decided to move, we shall look at another pair to trade.
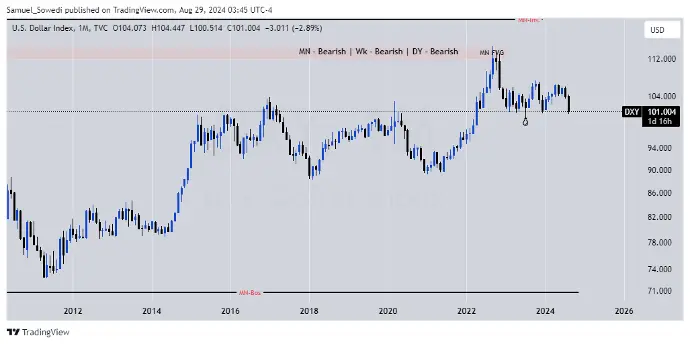 Monthly Chart
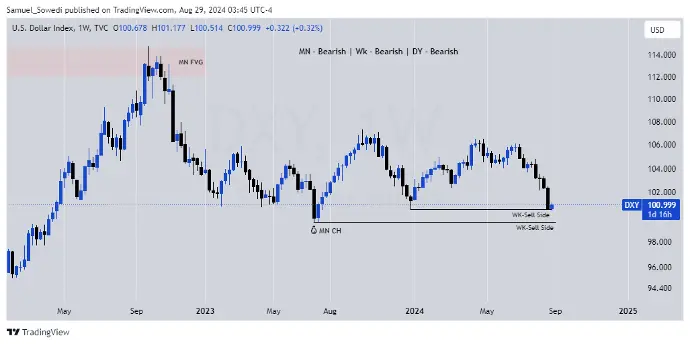 Weekly Chart
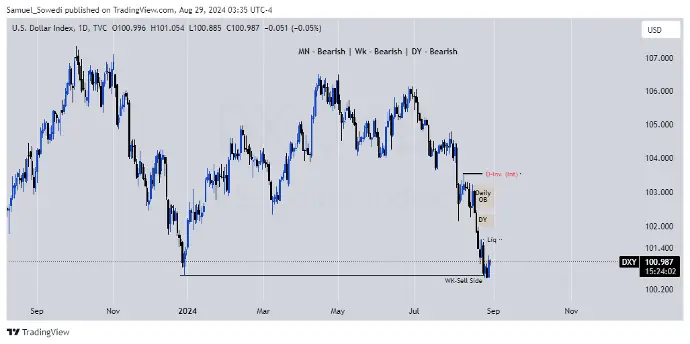 Daily Chart
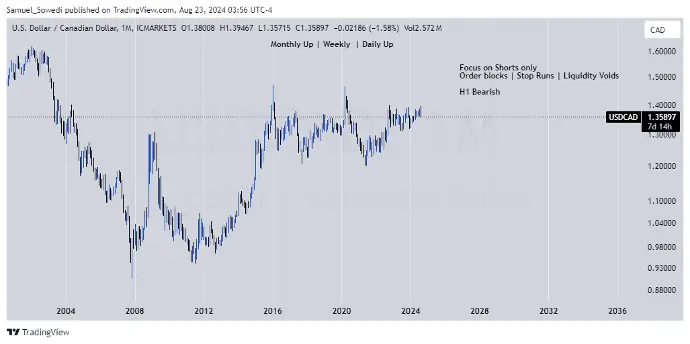 Monthly Chart
 Weekly Chart
 Daily Chart
 Monthly Chart
 Weekly Chart
 Daily Chart